The first section uses graphs taken from the module resources. This is to demonstrate my ability to embed graphs into the webpage.
The first chart shows GDP per capita in 6 different countries. The second graph charts GDP per capita against life expectancy for countries across the world.
I created these next two charts using the Economics Observatory Data Hub. The first chart shows UK labour productivity since 1970. The second shows UK business investment since 1996.
I attended the Festival of Economics lecture on UK productivity. One of the arguments was that the UK lacks innovation. My first graph shows there is a correlation between R&D spending and labour productivity. The second graph shows the level of UK spending on R&D.
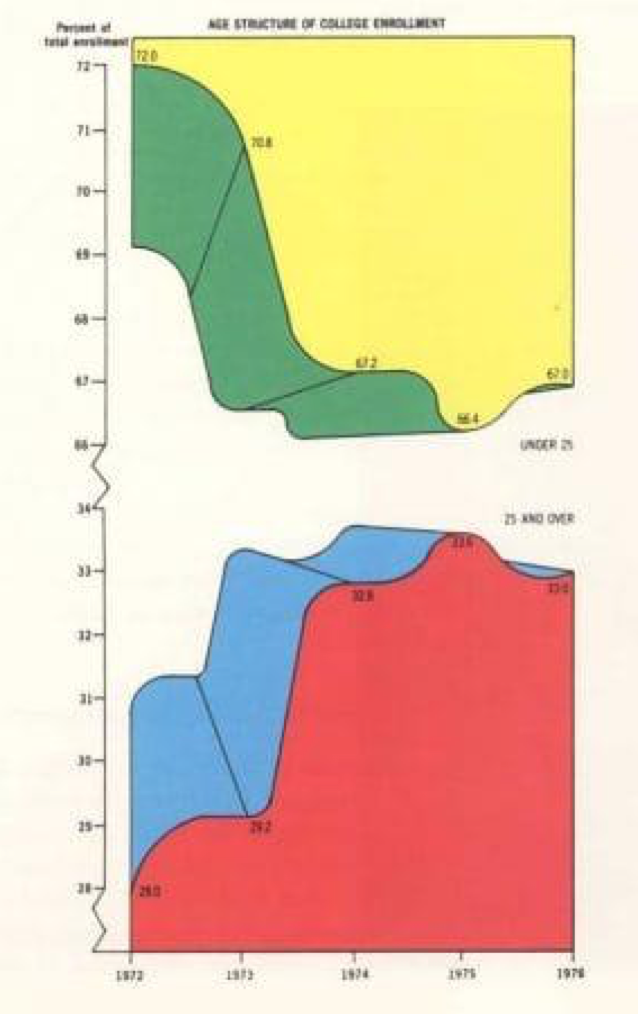
In this section I have taken "Tufte's Worst Example", replicated it and then improved upon it.

I have created a scraper which access the Wikipedia page on Olympic sailing to create a tally of medals. Python Notebook here
I have created 9 charts on capital formation in the UK. The data was batch downloaded from the ONS API using a python loop which can be found here.
Below are two maps of the Germany, divided into regions. The first just shows the country and district outlines, the second is a chloropleth showing employment level by region. My python notebook can be accessed here.
I have created two charts that use advanced analytics. The first is a regression of gross fixed capital formation against output per hour. I have conducted the regression on 10 major European economies and have divided the data into 4 time periods to try and control for exogenous shocks such as the GFC.
I have created 2 charts from UK prices data. The first shows the price of 5 selected goods from 1988 to the present day. The second is a chloropleth showing annual price changes across regions in the UK. The python notebook can be accessed here.
The first graph allows the user to select the year, and also highlights the data when the cursor is over. The second chart allows the user to 'brush' the desired time period on the lower graph. You can also select the lines or the legend to highlight a country.
The aim of my machine learning was to empirically prove the economic theory of conditional convergence. I plotted GDP growth rate against GDP per capita and used Gaussian Mixture to identify 3 clusters. The aim was to identify similar countries that are on a path of convergence. I then conducted regressions on each cluster to try and identify a linear relationship. The python notebook can be accessed here. The chart is also interactive, select which cluster to view from the legend, and scroll on the right hand chart to zoom in or out.